Clinical Profile in Diagnosed Cases of Alcoholic Liver Cirrhosis by Using Model of End Stage Liver Disease (MELD) Score
2 Department of Pathology, MGM Hospital, Aurangabad, Maharastra, India
Received: 05-Sep-2023, Manuscript No. amhsr-23-106505; Editor assigned: 07-Sep-2023, Pre QC No. amhsr-23-106505 (PQ); Reviewed: 22-Sep-2023 QC No. amhsr-23-106505; Revised: 29-Sep-2023, Manuscript No. amhsr-23-106505 (R); Published: 06-Jan-2023
Citation: Umesh R Malu, et al. Clinical Profile in Diagnosed Cases of Alcoholic Liver Cirrhosis by Using Model of End Stage Liver Disease (MELD) Score. Ann Med Health Sci Res. 2023; 13:838-844.
This open-access article is distributed under the terms of the Creative Commons Attribution Non-Commercial License (CC BY-NC) (http://creativecommons.org/licenses/by-nc/4.0/), which permits reuse, distribution and reproduction of the article, provided that the original work is properly cited and the reuse is restricted to noncommercial purposes. For commercial reuse, contact reprints@pulsus.com
Keywords
Alcoholic Liver Disease (ALD); Child Pugh score; Maddry’s Discrimination Score; MELD score
Introduction
The World Health Organization (WHO) defines cirrhosis of the liver as a diffuse process marked by liver necrosis, fibrosis, and the transformation of normal liver architecture into structurally aberrant nodules lacking normal lobular organization. As liver is the major site of alcohol metabolism, it suffers the most tissue damage from heavy drinking; Alcoholic liver disease is caused by chronic and severe alcohol drinking and includes three types of disease:
• Alcoholic fatty liver (Steatosis)
• Alcoholic Hepatitis (AH)
• Fibrosis/Cirrhosis [1].
Steatosis develops in drinkers after consuming 4-5 standard drinks per day for up to a decade. Fatty liver can progress to alcoholic hepatitis after chronic use of alcohol, which is a more severe, inflammatory type of alcoholic liver injury. Alcoholic hepatitis can progress to Alcoholic Fibrosis or Cirrhosis (ALC), which is characterized by excessive extracellular matrix protein deposition. The fibrotic response starts with active peri cellular fibrosis, which can lead to liver cirrhosis, which is marked by severe liver scarring, vascular changes, and eventually liver failure [1].
20% of alcoholics who consume more than 70 drinks per week for more than 20 years develop Alcoholic Liver Disease (ALD), while 7% develop Alcoholic Liver Cirrhosis (ALC). Females require lesser drinks than males for the development of Alcoholic Liver Disease (ALD), (7-13 drinks per week for females versus 14-27 drinks per week for men). According to the National Institute on Alcohol Abuse and Alcoholism of United state defined the amount of alcoholic beverage containing approximately 14 gram of pure alcohol is defined as a standard drink, The percentage of pure alcohol, expressed as alcohol by volume (alcohol/volume), varies by beverage; According to the National Institute on Alcohol Abuse and Alcoholism of United state defined the amount of alcoholic beverage containing approximately 14 gram of pure alcohol is defined as a standard drink, The percentage of pure alcohol, expressed as alcohol by volume varies by beverage [2,3] (Table 1).
| Beverages | Quantity Ounce (ml) | % Alcohol/Volume |
|---|---|---|
| Beer | 12 (360ml) | 5%-6% |
| Malt Liquor | 09 (270ml) | 7% |
| Wine | 05 (150ml) | 12% |
| Brandy | 1.5 (45ml) | 40% |
| Distilled Spirit | 1.5 (45ml) | 40% |
Table 1: Quantity of alcohol for standard drink in each beverages
Liver cirrhosis complications mainly divided in to two categories that is (A) Direct complications and (B) Indirect complications
• Direct complications
• Jaundice
• Hepatic Encephalopathy(HE),
• Ascites
• Upper Gastrointestinal bleeding (UGI bleeding), all these occurs due to loss of liver function and portal hypertension.
• Indirect complications includes
• Hepatorenal Syndrome(HRS),
• Spontaneous Bacterial Peritonitis(SBP)
• Hepatocellular Carcinoma (HCC) and infections [4].
In health-care settings, a variety of prognostic models are used. Some are generalized in use, while others are disease-specific. The Child-Turcotte-Pugh (CTP) score, the Model for End-stage Liver Disease (MELD) score, and Maddrey's Discriminant Function (MDF) are commonly used models in the treatment of patients with Alcoholic Liver Disease (ALD). The original MELD score is a prospectively established and validated chronic liver disease severity grading system that employs a patient's serum bilirubin, serum creatinine, and Prothrombin Time(PT), International Normalized Ratio (INR) to predict three-month survival (original MELD score). An increasing MELD score is linked to worsening hepatic dysfunction and a higher threemonth mortality risk in individuals with cirrhosis.
MELD was created to predict 3-month mortality in patients receiving Trans Jugular Intrahepatic Portosystemic Shunt (TIPS) operation to treat refractory bleeding of esophageal varices Conversely, the MELD has been confirmed to be a valuable predictor of death in patients with End Stage Liver Disease (ESLD) without a TIPS procedure. Currently, the MELD is utilized to help predict short term mortality for patients with ESLD and prioritize organ allocation on the liver transplant waiting list [5].
The MELD is measured using total bilirubin, creatinine, an International Normalized Ration (INR). These laboratory values are calculated using an algorithm to produce a numeric score. Scores range from 6 to 40, with 40 being demonstrative of the most serious stage of end stage liver disease [6].
The original mathematical formula for MELD score [7].
3.78 x loge (Bilirubin in mg/dl)+11.2 loge (INR)+9.57 loge (Creatinine in mg/dl)+6.43
My study was conducted studied on 100 cases of alcoholic liver cirrhosis with an aim to evaluate the outcome of alcoholic liver cirrhosis by applying MELD score and to compare of MELD score with other scores for outcome of alcoholic cirrhosis like Child-Turcotte-Pugh (CTP) and Maddrey Discriminant Function (MDF) .
Materials and Methods
The production of clotting factors along with essential proteins and detoxification of harmful metabolic products with excretion of bile these all are functions of the liver. Chronic liver disease is defined as the progressive worsening of liver function for more than 6 month approximately. This is a continuous process of liver parenchyma Inflammation, destruction and regeneration that leads to fibrosis or cirrhosis. Once fibrosis develops, hepatocytes loses their ability to regenerate.
The etiology affects the pattern of liver fibrosis, In case of alcoholic liver disease cirrhosis seen at centrilobular and perivenular area with periportal distribution. Chronic hepatotropic viruses like HBV and HCV causes cirrhosis of liver by periportal fibrosis and bridging fibrosis , Biliary tract disease related liver cirrhosis shows specific pattern of feathery degeneration of periseptal hepatocyte leading to presence of prominent halos and irregular shaped nodules. A study by Sarin et al reported HBV as the commonest cause of cirrhosis in adults (44.3%) as well as the young (50.8%), followed by alcohol in both adults (35.8%) and the young (15.9%). A study by Ray et al., from eastern India including 175 patients with chronic liver disease reported HBV (35.4%), HCV (14.9%), autoimmunity (2.8%), Wilson’s disease (2.8%) and alcohol (1.7%) as the commonest risk factors of cirrhosis [8].
Alcoholic Liver Disease (ALD) includes three stages of disease which includes
• Alcoholic fatty liver-occurs due to fat deposition in hepatocyte
• Alcoholic Hepatitis (AH)
• Alcoholic Liver Cirrhosis (ALC)
Epidemiology of Alcoholic Liver Disease
Heavy alcohol consumption is particularly common among persons with poor educational levels and income, the jobless and those who work in jobs that are stressful and low-paying [8].
Many factors play key role in development of alcoholic liver cirrhosis like age, sex, race, nutritional deficiency, genetic factors and other associated chronic disease like Hepatitis B and C.
• Age-The most common age group for alcoholic hepatitis is 4th to 5th decade of life [9].
• Sex-The relative risk for development of alcoholic liver disease is more in women compared to men with increasing alcohol intake, This type of difference is due to several factors such as differences in gastric Alcohol Dehydrogenase (ADH) levels, and a higher proportion of body fat in women [10,11].
• Obesity-Long-term obesity in alcoholics is an independent risk factor for alcoholic liver disease and cirrhosis
• Malnutrition-The majority of AH patients are malnourished and the risk of death is directly proportional to the degree of malnutrition
• Hepatitis B and C-When alcohol and HCV are combined together, they increase the risk of cirrhosis and Hepatocellular Carcinoma (HCC), as well as a faster progression to fibrosis and cirrhosis and decreased life expectancy.
Results
Pathophysiology of Chronic Liver Disease (CLD)
The pathophysiology of Chronic Liver Disease (CLD) is based on the idea that an acute triggering event in a patient with chronic liver disease,which injures hepatocyte, triggers a cascade of inflammatory cytokines, which leads to subsequent hepatic injury in case of hepatocyte regeneration failure. This syndrome causes immune system impairment and hepatic decompensation ,which leads to increased infection risk, multiple organ failure, and death. Cirrhosis of the liver is an end-stage organic disease caused by immunological dysfunction caused by macrophage loss of antimicrobial detection and clearance and decreased antigen presenting capacity by monocytes [12]. Albumin's anti-inflammatory, antioxidative, plasma expanding, and endothelium stabilizing properties are beneficial in patients with alcoholic liver cirrhosis who have spontaneous bacterial peritonitis and hepatorenal syndrome (a kind of acute injury to kidney) (Tables 2 and 3)
| Clinical findings | How to examine | Cause for clinical findings |
|---|---|---|
| Jaundice | Yellow discoloration of sclera and mucus membrane | Serum total bilirubin >2mg/dl |
| Cruveilhier Baumgarten syndrome | Epigastric vascular murmur by auscultation | Development of shunts from portal vein to umbilical vein branches |
| Caput medusa | Dilated vein around umbilicus | As a result of portal vein hypertension reopening of the umbilical vein causes blood to shunt from the portal vein. |
| Palmer erythema | Redness of palm with sparing of central area | Increased estradiol due to decreased it degredation |
| Splenomegaly | By palpitation or by ultra sonography | Portal hypertension |
| Ascites | By palpitation or by ultra sonography | Portal hypertension and low serum albumin |
| Spider angioma | Central arteriole with radiating vessel | Increased estradiol due to decreased it degredation |
| Flapping tremor (asterixis) | Jerky movement of outstretched palms | Increased serum ammonia leads to disinhibition of motor neurons |
| Gynecomastia | Holding nipple around aerola area in hand pinch | Conversion of androstenedione to estrone and estradiol and decrease in estradiol breakdown |
| Anorexia, Fatigue and weight loss | By asking proper history | Due to increased catabolic phenomenon & decreased appetite |
| Dupuytren’s contracture | Contracture and fibrosis palmer fascia | Due to increased oxidative stress |
| Nodular liver | Irregular liver on palpation | Due to irregular Fibrosis |
| Finger clubbing | Softening of nail bed | Hypoxia ,Porto-pulmonary hypertension |
| Diabetes mellitus | By measuring blood sugar level | Decresed use of glucose by liver |
| Testicular atrophy | Palpating scrotum | Due to increased estradiol |
Table 2: Clinical feature of liver cirrhosis.
| Laboratory parameters | Significance | Etiology |
|---|---|---|
| AST AND ALT | May be normal or elevated Ratio of AST/ALP >2 in ALD | Leakage from damaged hepatic cells |
| Bilirubin | Elevated (Important indicator of mortality) | Decreased hepatic andrenalexcretion(exacerbated by systemic inflammatory reaction |
| Albumin | Decreased | Sequestration into ascetic fluid and interstitium (exacerbated in systemic inflammatory reaction) and decreased hepatic production |
| Prothrombin time | Decreased | Decreased production of clotting factor V,VII and Vitamin K also |
| Sodium imbalance | Hyponatremia | Decreased water excretion by kidney due to enhanced activity of antidiuertic hormone |
| Anemia | Macro or microcytic | Folate and vitamin B -6,B-12 deficiecy ,UGI bleed |
| Alkaline phosphatase | Elevated but <3 times normal Value | Cholestasis |
| Albumin/globulin ratio | Reversed in liver cirrhosis (Normal value=1.5-3/1) | Decreased albumin production by liver cells |
Table 3: Laboratory finding of liver cirrhosis.
Complications of Chronic Liver Disease (CLD)
Common complication of alcoholic liver cirrhosis were
• Ascites (70%-74%)
• Hepatic encephalopathy (HE) (59%-60%)
• Upper gastro intestinal bleed (UGI bleed) (59%-60%)
• Hepatorenal syndrome(HRS)(35%-38%),
• Hepatopulmonary syndrome (HRS)(18%-20%)
Common symptoms seen during alcoholic liver cirrhosis are
• Abdominal pain(55%-60%) and distension(78%)
• Jaundice(60%)
• Ascites(72%-74%)
• Icterus(60%-62%)
• Pedal oedema (60%-64%) are common clinical signs.
Scores used for prognosis of chronic liver diseases used in this study
• Child Pugh score (CP score)
• Model of End Stage Liver Disease Score (MELD)
• Maddrey’s Discriminant Function (MDF)
Child Pugh score (CP score)
CTP score includes five factors that is Ascites, Encephalopathy, Serum bilirubin, Serum albumin and Prothrombin Time (PT) and assigned score for each variable from 1 to 3 and Chronic Liver Disease (CLD) is classified into CTP classification in to three category A (Score up to 6), B (7 to 9) and C (10-15), using the final score derived from variables , with the resulting classes having different prognostic implications as shown below (Table 4).
| Score | Class | 1 Year survival | 2 year survival |
|---|---|---|---|
| 5-6 | A | 100% | 85% |
| 07-09 | B | 81% | 57% |
| 10-15 | C | 45% | 36% |
Table 4: CTP score and survival.
Model of End Stage Liver Disease Score (MELD)
Patients with end-stage liver disease who are candidates for Liver Transplant (LT) had a linear relationship between mortality and MELD score uses the patient’s values for Serum bilirubin, Serum creatinine, and International Normalized Ratio for prothrombin time (INR) to predict survival. It is calculated according to the following formula
3.78 x loge (Bilirubin in mg/dl)+11.2 loge (INR)+9.57 loge (Creatinine in mg/dl)+6.43
According to this modified score, patients with bilirubin and creatinine values below 1 mg/dL are rounded off to 1 mg/dL to avoid negative logarithmic values. Patients with an INR of less than 1 are also rounded up to one. The score is empirically capped at a value of 40, regardless of the individual values. As a result, MELD score is a continuous variable with a range of 6 to 40. From 2002, the MELD score has been used to allocate organs to patients awaiting liver transplantation .Patients with the highest MELD score have priority for organ allocation under the MELD-based policy (Table 5).
| Score | Mortality at 3 months |
|---|---|
| <9 | 4% mortality |
| Oct-19 | 27% mortality |
| 20-29 | 76% mortality |
| 30-39 | 83% mortality |
| 40 or > | 100% mortality |
Table 5: MELD score and survival.
Maddrey’s Discriminant Function (MDF)
The Maddrey Discriminant Function (MDF) score is a measure of disease prognosis in Alcoholic Hepatitis (AH) that is used to identify individuals with the highest risk of mortality and to determine when pharmacologic therapy should be initiated. Patients with severe AH, defined as a modified Maddrey's discriminant function (mDF>32), have a high short-term death rate and may benefit from certain medications that improve short-term survival, such as corticosteroids. Pharmacologic therapy, on the other hand, is not indicated for less severe patients (mDF<32), particularly those without hepatic encephalopathy, because they are unlikely to benefit from it.Patients with AH with an MDF<32 have a 1-month fatality rate of less than 10% and are usually not evaluated for specific therapy.
Benefits of MELD score-MELD score offers convincing advantages over Child–Pugh. MELD score relies on a triad of simple and objective biological variables, which facilitates comparisons between populations. These biological variables, in contrast to Ascites and encephalopathy are not influenced by individual judgment and may only be slightly altered by external factors. The score itself is a continuous variable which helps ranking appropriately and precisely patients within large populations. It proven to be a reliable prognostic indicator across a wide range of cirrhosis severity and etiology. The addition of a renal function marker in the score is likely one of the deciding factors in the MELD score's superiority over the Child–Pugh score in some domains. Moreover, the MELD measure has been prospectively confirmed in the context of organ allocation prioritization and post-TIPS survival. Its capacity to forecast early death after listing is especially useful when liver transplant allocation is involved.
Limitations of MELD score-All the variables in the MELD model were chosen empirically, because they were thought to have an impact on the result or because they were easily accessible. The three variables in the MELD score (Bilirubin, Creatinine, and INR) are objective variables depending on the methodologies used for determination, there are significant differences in INR amongst laboratories. The multiplicative value of INR is the highest of the three MELD score variables. As a result, fluctuations in INR might result in MELD score discrepancies of up to 20%. Significant variations in serum Creatinine can occur in people with cirrhosis, especially when serum bilirubin levels rise.
Discussion
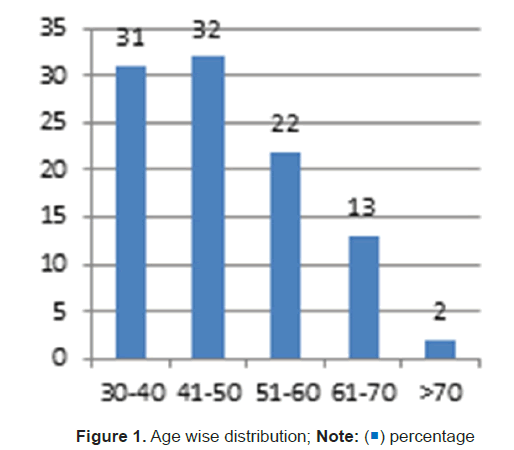
Distribution of study subjects according to age (Figure 1)-Out of 100 cases studied Majority 32(32%) were in age group of 41-50 years followed by 31(31%) cases in age group of 30-40 years followed by 22(22%) in age group of 51-60 years .Mean age was 48.63 ± 10.63 years ranging between 32-76 years.
Distribution of study subjects according to gender-All 100 (100%) cases were males as female who was coming to my hospital are non alcoholic.
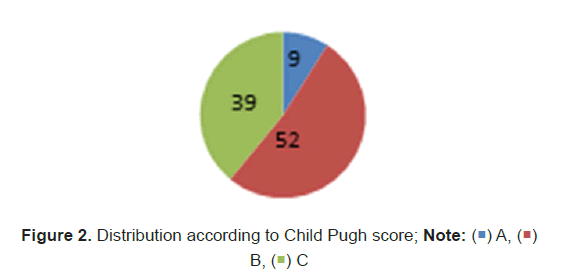
Distribution of study subjects according to Child Pugh score (Figure 2)-Majority 52 (52%) cases were in class B of Child Pugh score followed by 39 (39%) in class C and rest 09(9%) were in class A of CTP score (Figure 2).
Distribution of study subjects according to complications (Figure 3)-There were multiple complications in cases and maximum 32 (32%) cases had hepatic encephalopathy as most common complication followed by refractory ascites in 29 (29%) cases. Hepato renal syndrome was seen in 22 (22%) cases (Figure 3).
Distribution of study subjects according to final outcome (Figure 4) Out of 100 cases, 18 (18%) cases died during study period. Hepatic encephalopathy was final outcome in 32 (32%) cases. Hepatorenal syndrome and refractory ascites was seen in 09 (9%) cases respectively. Spontaneous bacterial peritonitis was seen in 07 (7%) cases (Figure 4).
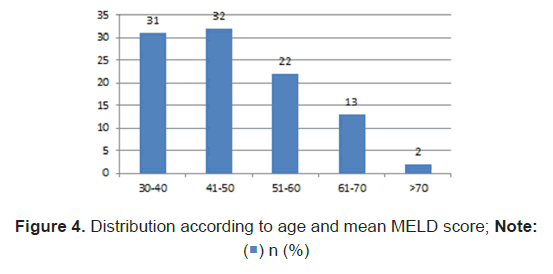
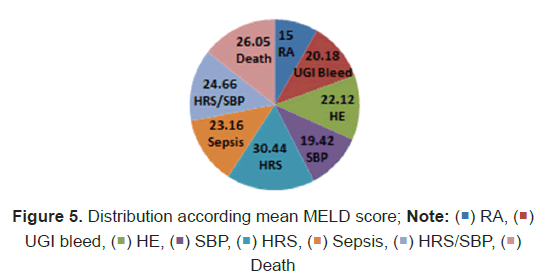
Distribution of study subjects according to age and mean MELD score (Figure 5)-Mean MELD score was maximum (24.22 ± 8.78) in age group of 51-60 years followed by 23.84 ± 8.71 in age group of 41-50 years followed by 21.25 ± 7.91 in age group of 30-40 years (Figure 5).
Distribution of study subjects according to final outcome and mean MELD score (Table 6) When mean MELD values were compared in different final outcomes, it was found to be statistically significant. (p value=0.001) (Table 6), (Figure 5).
| Final outcome | Number | Mean MELD score | Standard deviation | t test P value | |
|---|---|---|---|---|---|
| RA | 9 | 15 | 4.63 | 0.001* | |
| UGI bleed | 16 | 20.18 | 7.22 | ||
| HE | 32 | 22.12 | 8.03 | ||
| SBP | 7 | 19.42 | 4.92 | ||
| HRS | 9 | 30.44 | 10.46 | ||
| Sepsis | 6 | 23.16 | 3.76 | ||
| HRS/SBP | 3 | 24.66 | 5.85 | ||
| Death | 18 | 26.05 | 7.99 | ||
Table 6: Distribution of study subjects according to final outcome and mean MELD score.
Distribution according to mean MELD score range and Final outcome (Table 7) Death was more in cases with MELD score between 21-30 followed by 11-20 score (Table 7).
| MELD score | RA | UGI Bleed | HE | SBP | Sepsis | HRS | HRS/SBP | Death | Total |
|---|---|---|---|---|---|---|---|---|---|
| 05-10 | 1 | 2 | 0 | 0 | 0 | 0 | 0 | 0 | 3 |
| 11-20 | 7 | 6 | 17 | 5 | 2 | 1 | 1 | 5 | 44 |
| 21-30 | 1 | 7 | 12 | 2 | 4 | 3 | 2 | 8 | 39 |
| 31-40 | 0 | 1 | 2 | 0 | 0 | 4 | 0 | 4 | 11 |
| >40 | 0 | 0 | 1 | 0 | 0 | 1 | 0 | 1 | 3 |
Table 7: Distribution according to mean MELD score range.
Distribution of study subjects according to final outcome and Child Pugh score (Table 8). Out of 9 cases in class A,5 cases had UGI bleed,3 cases had refractory ascites and 1 with spontaneous bacterial peritonitis, Out of 52 cases of class B, 19 cases had hepatic encephalopathy and 10 had death. Out of 39 cases of class C, 13 cases had hepatic encephalopathy.
| Final outcome | N | Child Pugh score | ||
|---|---|---|---|---|
| A (5-6) (n) | B(7-9) (n) | C(10-15) (n) | ||
| Refractory Ascites | 9 | 3 | 4 | 2 |
| UGI bleed | 16 | 5 | 7 | 4 |
| HE | 32 | 0 | 19 | 13 |
| Hepatorenal syndrome | 9 | 0 | 2 | 7 |
| SBP | 7 | 1 | 3 | 3 |
| Sepsis | 6 | 0 | 5 | 1 |
| HRS/SBP | 3 | 0 | 2 | 1 |
| Death | 18 | 0 | 10 | 8 |
| Total | 100 | 9 | 52 | 39 |
Table 8: Distribution of study subjects according to final outcome and Child Pugh score.
Distribution of study subjects according to final outcome in manner of death or alive and mean MELD score (Table 9)-When MELD scores in alive and deceased were compared by applying t test, it was found to be statistically significant. (p value=0.04)
| Final Outcome | Number | Mean ± SD MELD score | T test p value |
|---|---|---|---|
| Alive | 82 | 21.81± 8.10 | 0.04* |
| Dead | 18 | 26.05 ± 7.99 |
Table 9: Quantity of alcohol for standard drink in each beverages.
Distribution of study subjects according to final outcome and mean Maddrey’s discriminate function (Table 10)-Mean DF was not significantly different in alive and deceased patients.
| Final Outcome | Number | Mean ± SD DF value | T test p value |
|---|---|---|---|
| Alive | 82 | 54.044 ± 43.61 | 0.9 |
| Dead | 18 | 50.44 ± 37.21 |
Table 10: Distribution of study subjects according to final outcome and mean Maddrey’s discriminate function.
Comparison of severity of score and mortality between MELD and CTP score (Table 11)-Only 2 mortality matched according to severity of both scores.
| Sr no | Duration of mortality from diagnosis in months | MELD score | CTP score | Comparison of mortality in two scores |
|---|---|---|---|---|
| 1 | 2month | 33 | B | Not matched |
| 2 | 4month | 38 | C | Matched |
| 3 | 1month | 43 | C | Matched |
| 4 | 2.5month | 31 | B | Not matched |
| 5 | 1month | 20 | B | Not matched |
| 6 | 5month | 26 | C | Not matched |
| 7 | 3month | 11 | B | Not matched |
| 8 | 1month | 20 | B | Not matched |
| 9 | 1month | 29 | B | Not matched |
| 10 | 2month | 28 | C | Not matched |
| 11 | 1month | 18 | C | Not matched |
| 12 | 2month | 15 | B | Not matched |
| 13 | 1month | 23 | A | Not matched |
| 14 | 1month | 12 | B | Not matched |
| 15 | 1month | 34 | B | Not matched |
| 16 | 1month | 27 | C | Not matched |
| 17 | 1month | 23 | C | Not matched |
| 18 | 2month | 25 | C | Not matched |
Table 11: Comparison of severity of score and mortality between MELD and CTP score.
Measures of central tendency for MELD score in study subjects (Table 12)-Central tendency for MELD score in study subjects. Mean, Median and mode MELD score was 22.58 ± 8.21, 22 and 18 respectively
| Measures of central tendency | MELD score values |
|---|---|
| Mean | 22.58 ± 8.21 |
| Median | 22 |
| Mode | 18 |
Table 12: Measures of central tendency for MELD score in study subjects.
Summary of study
Total 100 cases of alcoholic liver cirrhosis where studied during this study for 2 years at MGM hospital, Aurangabad, Maharashtra, India
• Mean age was 48.63+/- 10.63 years ranging between 32-76 years.
• All 100 (100%) cases where male.
• Majority 52% cases were in class B of Child Pugh score followed by 39 (39%) in class C
• Majority 51 (51%) cases had duration of illness between 1-4 month followed by 35% cases with 4-18 month
• There are multiple complication in case and maximum 32% cases had hepatic encephalopathy as most common complication followed refractory Ascites.
• Mean, Median and Mode of MELD score was 22.58+/- 8.21,22 and 18 respectively.
• Out of 100 cases 18 (18% cases) died during study period
• Mean MELD score was maximum (24.22+/- 8.78) in age group of 51-60 years followed by 23.84+/- in age group of 41-50 years
• When MELD score in alive and dead patient were compared by applying t test, it was found to be statistically significant. (p value=0.04)
• Mean DF was not significantly different in alive and dead patient.
Conclusion
The MELD score confirmed as predictor of survival in patient of alcoholic liver cirrhosis, Alcoholic hepatitis and alcoholic liver failure ,The said theme of MELD score in relation to degree of sickness is studied and analysed in present study. The clinical profile and MELD score quantile justified in the present study and does not show any discrepancy related to seriousness of complication of MELD score.
The mortality as stated by MELD quantile Criteria (31-40 and >40) is observed. In this quantile 5 patient died within period 2.1 month from diagnosis of alcoholic liver cirrhosis, Same 5 patient when observed by applying CTP score criteria (Class B and C) did not survived for period of 1 year, CTP score delineates survival rate of 2 year(Class B 57% and C-36%) and 1 year(Class B 81% and C-45%) respectively, Therefore it is suggested while evaluating any case of chronic liver disease including alcoholic liver cirrhosis ,for prediction of survival and mortality rate combined application of these system and there score should be adopted reason being the seriousness of illness with CTP score is symptoms complex based while MELD score is laboratory based.
References
- Osna NA, Donohue TM, Kharbanda KK. Alcoholic liver disease: Pathogenesis and curren management. Alcohol Res. 2017;38:147–61.
[Google Scholar], [PubMed]
- Robert E. Mann, Reginald G. Smart, Richard Govoni. The epidemiology of alcoholic liver disease. Alcohol Res Health. 2003; 27: 209–219.
- Goyal P, Kaur D, Chhina RS, Goyal O. Etiological profile of cirrhosis in a tertiary care institute in Northern India. J Gastrointest Infect. 2018;8:28–31.
- Kamath PS, Kim WR. The Model for End-stage Liver Disease (MELD).Hepatology. 2007;45:797–805.
- Antaki F, Lukowski A. The Model for End-stage Liver Disease (MELD) predicts survival of liver cirrhosis patients after discharge to hospice. J Clin Gastroenterol. 2007;41:412–5.
[Crossref] [Google Scholar], [PubMed]
- Kamath P, Weisner R, Malinchoc M. A model to predict survival in patients with end-stage liver disease. 2001;464–70.
[Crossref] [Google Scholar], [PubMed]
- Sarin SK, Chari S, Sundaram KR, Ahuja RK, Anand BS, Broor SL. Young v adult cirrhotics: A prospective, comparative analysis of the clinical profile, natural course and survival. Gut. 1988;29:101–7.
[Crossref] [Google Scholar], [PubMed]
- Basra S, Anand BS. Definition, epidemiology and magnitude of alcoholic hepatitis. World J Hepatol. 2011;3:108–13. [Crossref]
[Google Scholar], [PubMed]
- Lucey M, Mathurin P, Morgan T. Alcoholic hepatitis. N Engl J Med.2009;360(10):2758–69. [Crossref]
- Becker U, Deis A, Sørensen TIA, Gronbaek M, Borch-Johnsen K, Müller CF, et al. Prediction of risk of liver disease by alcohol intake, sex, and age: A prospective population study. Hepatology. 1996;23:1025–9.
[Crossref] [Google Scholar], [PubMed]
- Frezza M, Terpin MM. Acute alcoholic hepatitis: Clinical and therapeutic considerations. G Clin Med. 1990;71:707–16.
- Gupta M, Dadhich S, Bhargawa N. Clinical profile of patients with Acute-on-Chronic Liver Failure. Journam Gastroenterol and pancreatic Dis. 2016;1:1007.

 ) percentage
 )
B, (
 ) C
) C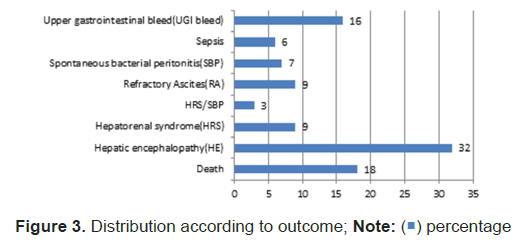
 ) SBP, (
 ) HRS, (
 ) Sepsis, (
 ) HRS/SBP, (
 )
Death


 The Annals of Medical and Health Sciences Research is a monthly multidisciplinary medical journal.