Qualitative Analyses of the Antimicrobial Effect of Ozonated Water on Supragingival Plaque and Salivary Microbes
- *Corresponding Author:
- Dr. Syed Sadatullah
Department of Maxillofacial Surgery and Diagnostic Sciences, College of Dentistry, King Khalid University, Post Box 3263, Abha 61471, Kingdom of Saudi Arabia.
E-mail: dr.sadat@hotmail.com
Abstract
Background: Ozone is an unstable gas, capable of oxidizing any biological entity. It is an effective bactericide in its gaseous as well as aqueous form. Aims: The objective of this study was to determine the in‑situ antimicrobial effect of 0.1 ppm ozonated water on plaque and salivary microorganisms. Subjects and Methods: 24 h old supragingival plaque (SP) was collected from the two most posterior teeth in the contralateral quadrants before and after a 30 s rinse with either distilled water (control group) or 0.1 ppm ozonated water (test group). Simultaneously stimulated whole saliva (SWS) was collected for both groups. The SP and SWS were stained with LIVE/DEAD Baclight Bacteria Viability fluorescent kit to visualize live and dead microbes. The salivary flow rate, calcium and protein level were also determined in the pre‑ and post‑rinsed samples. The data obtained was subjected to One Way ANOVA test using Minitab 14 statistical software (PA, USA). Results: 0.1 ppm ozonated water was found effective in reducing the bacterial load in both the 24 h plaque and SWS samples, but it did not eliminate them completely. In addition, there was no statistically significant effect of the ozonated water rinse on the salivary flow rate, salivary calcium and protein concentration. Conclusions: 0.1 ppm ozonated water rinse can be an effective adjunct to tooth brushing and flossing to maintain plaque and salivary bacterial load.
Keywords
Fluorescent staining, In-situ plaque, Ozonated water, Saliva
Introduction
Varying microhabitats within the oral ecosystem create numerous micro-conditions that vary with respect to oxygen levels and anaerobiosis, the availability of nutrients, accessibility to salivary secretions or gingival crevicular fluid and responses to masticatory forces. Dental plaque is the precursor that initiates the progression of most oral diseases. It is invariably involved in the etiology of common oral diseases such as dental caries and periodontal disease, as well as the less commonly occurring ones such as perimplantitis.[1] The composition and flow rate of the saliva provides multiple defense system against cariogenic bacteria.[2,3] Components such as salivary proteins, enzymes and lactoferrin have been known to act as effective bactericides to protect the oral cavity against potentially pathogenic microorganisms.[4] Secretory immunoglobulin A for example, is the predominant immunoglobulin of the saliva that inhibits bacteria. On the other hand, lysozyme is an antibacterial enzyme that attacks and causes lysis of bacterial cells.[5] ά-amylase hydrolyses the chain of starch and initiates the process of digestion that begins to catalyze large polysaccharides into glucose and maltose in the oral cavity.[6] In addition to its digestive function, ά-amylase is also a binding receptor for cariogenic bacteria to pellicle-coated tooth surface. Salivary glycoproteins such as mucin also help in lubricating the intraoral surfaces and maintain the integrity of the oral mucosa.[7] Inorganic ions such as calcium and phosphate that get secreted into the oral cavity from the salivary glands also plays important role in the maintenance of the oral health. The level of these ions, which exhibit diurnal fluctuation, are the major buffering components of the saliva that neutralizes its pH and maintains the oral environment at neutral condition.[8,9] The supersaturation of saliva with respect to calcium and phosphate is also crucial in encouraging remineralization and crystal growth of the enamel. The interrelationship between components of the oral ecosystem and the initiation oral diseases such as caries has long been recognized.
Many antibacterial mouth washes have been used to inhibit the growth and control the flourish of oral bacteria. Phenolic compounds which are known to possess germicidal activities have been used for more than 100 years. Listerene® is one such product containing thymol. Listerene® has been put to long-term studies and has shown to reduce plaque and decrease the severity of gingivitis.[10] Sanguinarine and triclosan are other examples of active components of plant that have been reported to possess anti-plaque and anti-gingivitis properties and are incorporated in mouthwashes and dentifrices.[11,12] Triclosan was reported effective against gram positive and gram-negative bacteria and does not stain or alter the taste, but has poor substantivity.[13]
Chemical-based active compounds have also been popular in oral healthcare products. Acidified sodium fluoride was first used as a mouthwash in the early 1940’s. By the 60’s fluoride mouthwashes showed promising clinical results in terms of plaque inhibition and caries prevention.[14] Another active components of mouth-washes popularly used until now is chlorhexidinegluconate (CHX), which is a bisguanide that have been proven to possess wide spectrum of antimicrobial activities. The currently accepted concentration of 0.12% CHX is supposedly the most effective concentration causing reduction of 55-60% of plaque and 45% of gingivitis.[11] Oxygenating agents like hydrogen peroxide are other disinfectants, which are also used as antimicrobials in oral health care to control periodontitis.[15]
Ozone is a strong disinfectant which readily dissolves in water. The activity of ozonated water is similar to ozone in its gaseous form.[16] The effectiveness of ozonated water on human plaque biofilm is comparable to other commonly used antimicrobial agents such as povidone iodine and benzylthonium chloride.[17] Due to its antibacterial activity ozone has been used to treat primary root caries, clean and disinfect dentures and in the treatment of dental unit water lines. The main objective of this study was to assess the in-situ antimicrobial effect of 0.1 ppm ozonated water on plaque and salivary microorganisms following a 30 s rinse. In addition, the effect on salivary flow rate and the level of salivary calcium and protein following the rinse were also analyzed.
Subjects and Methods
A total of 40 healthy volunteers comprising of 27 females (67.5%) and 13 males (32.5%) between the age of 18 to 40 years having 20 periodontally healthy permanent teeth were included in the study. All volunteers were given a detailed outline and explanation of the procedure and a brief account of the research aims and objectives. The subjects were asked not to brush their teeth or use any other form of mouth rinse 24 h prior to sample collection. Medically compromised patients or individuals having taken antibiotic orally or parentally in the past 30 days were excluded from the study. Ethics approval was obtained from the Dental Faculty Ethics Committee prior to the commencement of the study. All the volunteers were asked to sign a consent form after reading a brief description of the study.
Study groups
The volunteers were randomly distributed and grouped using convenient sampling, as control group (CG) and test group (TG). 20 ml of sterile distilled water (for CG) and 0.1 ppm ozonated water (for TG) was used to rinse for 30 s. Collection of supragingival plaque (SP) and stimulated whole saliva (SWS) samples from CG and TG were carried out in two batches, (i) pre-rinse and (ii) post-rinse samples. Pre-rinse samples provided the baseline data for the study. Post-rinse samples provided data on the rinsing effect of the two types of water. Post-rinse samples were collected 20 min after the rinse for both groups. The analysis of the effect of 0.1 ppm ozonated water on SP and SWS was based on qualitative test to demonstrate the viability of microbes in the samples using fluorescence staining. The effect of rinsing with ozonated water on the rate of saliva flow and levels of salivary calcium and protein were also determined.
Collection of SP samples
The pre- and post-rinsed in-situ SP samples were collected from the buccal and lingual surfaces of the teeth using a sterile stainless steel excavator. The excavator was used in several gentle scooping motions to avoid contact with the marginal gingiva and the SP was transferred into a microfuge vial containing sterile reduced transport fluid (RTF).[18] The oxygen content of the RTF was reduced with the addition of tricholoracetic acid. The pre-rinse SP samples were collected from the three most posterior teeth on the upper right and lower left quadrants, whereas the post-rinse SP samples were collected from the three most posterior teeth on the upper left and lower right quadrants (contralateral teeth).
Collection of SWS samples
Pre- and post-rinsed SWS samples were collected after a standardized chewing exercise. The volunteers were seated upright in a dental chair with their head unsupported. A piece of sterile cotton pellet was given to chew on. The size of the cotton pellet was standardized, measuring approximately equal to the size of the thumb. The chewing time was fixed at 1 min for all the volunteers. They were asked to chew slowly and change the chewing side frequently to achieve maximum stimulation. Saliva for the first 2 min after chewing was discarded and not used for analysis. Following which they were asked to collect saliva on the floor of the mouth and spit in a funnel leading to the graduated test tube for 5 min. The salivary flow rate was calculated as ml/min by dividing the volume of saliva collected in 5 min.
Preparation of ozonated water
Ozone gas produced from an ozone generator (ORM AW600) was introduced into 1 L of sterile distilled water for 20 min. The concentration of dissolved ozone in the water was monitored and kept at concentration between 0.08 and 0.1 ppm using a portable dissolved ozone meter (EcoZone™ EZ10W, Ecosensors Inc., Newark, USA). The freshly prepared ozonated water was used within 20 min after its preparation.
Microbiological and biochemical tests
The viability of microbes in SP and SWS samples was analyzed using the commercially available LIVE/DEAD BacLight Bacteria Viability Kit™ (L/D BBV, Molecular Probes, Inc.). This kit utilizes fluorescent dyes that stain live and dead bacteria fluorescent green and fluorescent red, respectively. The vial containing SP sample and RTF was vortexed and emptied in 4 ml of BHI broth (Oxoid, Hampshire, UK). The broth was incubated for 24 h at 37°C. Following incubation, 1 ml of the growth suspension was centrifuged and washed three times with 0.85% saline. The microbial cell pellet was stained using L/D BBV kit according to the manufacturers’ instructions [Appendix 1].
To test for the viability of microbes in the SWS samples, 0.5 ml of the saliva sample was added to 4.5 ml of BHI broth and incubated for 24 h at 37°C. The growth suspension was then stained as was done with the SP samples. The stained samples were viewed under a fluorescent microscope. The excitation emission maxima for component A (SYTO 9 die) was between 480/500 nm and for component B (propodium iodide) was between 490/635 nm. Five fields were observed for all the slides; four fields from the four corner of the viewing area and one in the middle. The viewing fields of the slides were photographed and visually analyzed.
Salivary calcium and protein concentration
Salivary calcium and protein concentration was analyzed by titration [Appendix 2] and spectrophotometry method [Appendix 3], respectively. The data obtained was subjected to One Way ANOVA test using Minitab 14 statistical software (PA, USA).
Results
Effect on microbial load
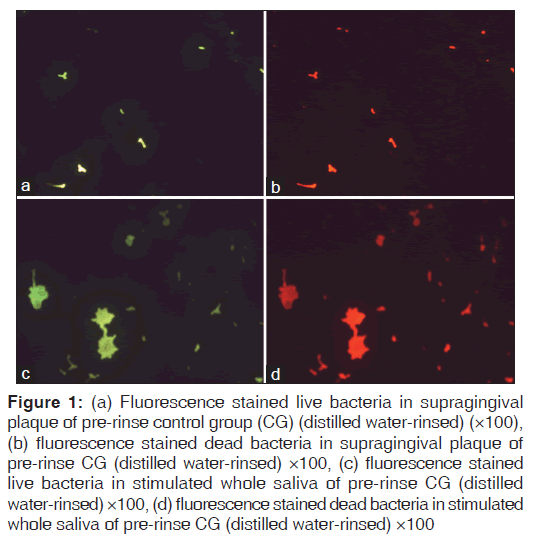
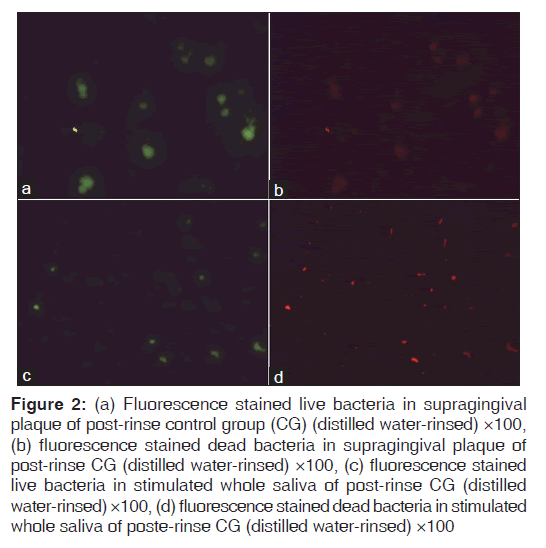
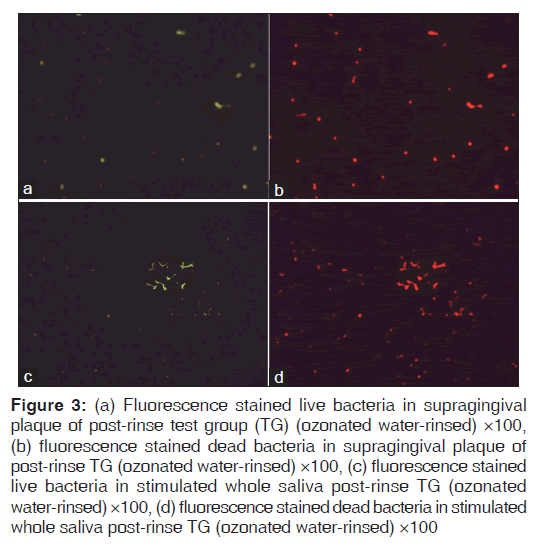
Figures 1-3 show fluorescence stained live and dead bacteria cells of random SP and SWS samples from both the control and test groups. No visual difference was observed between the fluorescent green and fluorescent red fields for the pre-rinse SP and SWS samples of CG [Figures 1a-d]. A very minimal visual difference was observed between live (fluorescent green) and dead (fluorescent red) microbes for the post-rinse SP and SWS samples of CG [Figures 2a-d]. However, a very contrasting visual difference was observed between the fluorescent green and fluorescent red fields for the post-rinse SP and SWS samples of the TG. The red fluorescent areas representing dead microbial cells were appreciably more than the green fluorescent areas representing live microbial cells [Figure 3a-d]. This was true for all the post-rinse samples of TG samples. As this was a qualitative test, statistical analysis was not performed. Nevertheless, it is safe to mention that ozonated water rinse resulted in an increase of the load of dead microbial cells in both 24 h SP and SWS samples.
Figure 1: (a) Fluorescence stained live bacteria in supragingival plaque of pre-rinse control group (CG) (distilled water-rinsed) (×100), (b) fluorescence stained dead bacteria in supragingival plaque of pre-rinse CG (distilled water-rinsed) ×100, (c) fluorescence stained live bacteria in stimulated whole saliva of pre-rinse CG (distilled water-rinsed) ×100, (d) fluorescence stained dead bacteria in stimulated whole saliva of pre-rinse CG (distilled water-rinsed) ×100
Figure 2: (a) Fluorescence stained live bacteria in supragingival plaque of post-rinse control group (CG) (distilled water-rinsed) ×100, (b) fluorescence stained dead bacteria in supragingival plaque of post-rinse CG (distilled water-rinsed) ×100, (c) fluorescence stained live bacteria in stimulated whole saliva of post-rinse CG (distilled water-rinsed) ×100, (d) fluorescence stained dead bacteria in stimulated whole saliva of poste-rinse CG (distilled water-rinsed) ×100
Figure 3: (a) Fluorescence stained live bacteria in supragingival plaque of post-rinse test group (TG) (ozonated water-rinsed) ×100, (b) fluorescence stained dead bacteria in supragingival plaque of post-rinse TG (ozonated water-rinsed) ×100, (c) fluorescence stained live bacteria in stimulated whole saliva post-rinse TG (ozonated water-rinsed) ×100, (d) fluorescence stained dead bacteria in stimulated whole saliva post-rinse TG (ozonated water-rinsed) ×100
Effect on salivary components
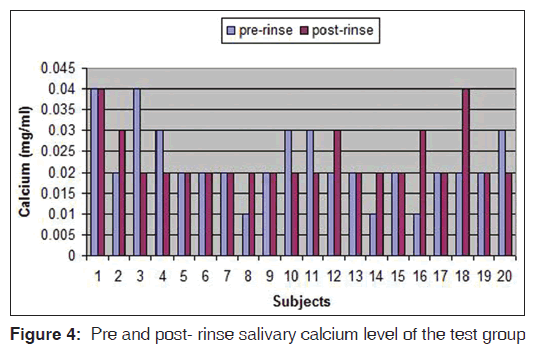
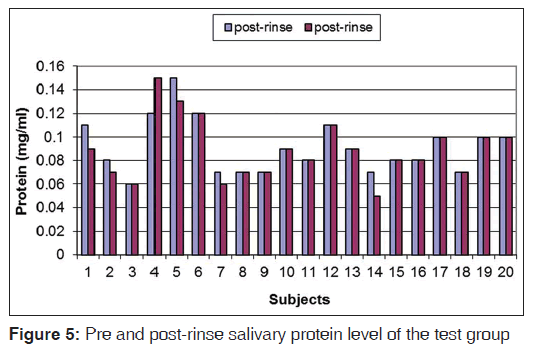
The pre-rinse and post-rinse concentrations of salivary calcium and protein for TG are given in Figures 4 and 5. Differences between the pre-rinse and post-rinse concentration values were calculated and compared between the two groups by one way analysis of variance (ANOVA Minitab 14). Neither distilled water rinsing nor ozonated water rinsing had a statistically significant effect on the salivary calcium and protein concentration (P = 0.12)
Effect on salivary flow rate
Similar to the salivary calcium and protein concentration, difference between the pre-rinse and post-rinse salivary flow rate values were calculated and compared between the groups. Both distilled water and ozonated rinsing had no statistical difference on the salivary flow rate (P = 0.16).
Discussion
The aim of specific plaque hypothesis is to convert odontopathic plaque to non-disease associated plaque instead of completely eliminating its accumulation.[19] The current study qualitatively demonstrated an increase of dead microbes rather than their complete elimination in 24 h old in-situ plaque biofilm [Figure 3a and b]. Similar effect of ozonated water was observed on the planktonic salivary microbes [Figure 3c and d]. This increase in dead cells can be attributed to the antimicrobial effect of ozonated water at 0.1 ppm concentration. Ozone disinfects by rapidly rupturing the cell membrane of bacteria. It acts by inducing oxidation of the cell wall and cytoplasmic membranes that leads to the lysis of the microorganism. An ultrastructure study using the scanning electron microscope has demonstrated Streptococcus mutans treated with ozonated water showed the presence of holes in the membrane. The results of this study suggested that the bactericidal activity of ozonated water might be through the disruption of its cytoplasmic membrane.[17] The SYTO® dye of the L/DBBV kit stains all bacteria in a population, including those with intact and damaged membrane. Propodium iodide stains only bacteria with damaged membranes causing a reduction of the SYTO stain fluorescence. Bacteria with intact cell membranes appear fluorescent green whereas bacteria with damaged membrane appear fluorescent red.[20] This gives a reliable visual account of the viability of the stained bacterial cells.[21] However, to quantify these results custom made computer software is required which are not available commercially.
The ozonated water rinse effect on the microbial load demonstrated in the present study confirms with a similar study done concurrently by the same authors on specific plaque microbes grown on selective agar media.[22] The average reduction observed for the streptococci load (56.4%) was more than that observed for the total bacteria (45.3%) and the anaerobes (51.7%).
The effect of single dose of two mouth rinses containing oxidizing agents on salivary bacteria was reported by Moran et al.[23] Both mouth rinses produced reduction in bacterial count but it was not significant when compared with a negative control saline rinse. When both mouth rinses were studied on plaque, they induced an inhibition of plaque accumulation over a period of time. Zaura-Arite et al.,[24] studied the immediate effect of 0.2% chlorhexidine on in-situ biofilm grown on bovine dentine discs that were worn inside human mouth. The treatment had a significant effect when evaluated using vital fluorescence technique. Pan et al.,[25] studied the bactericidal effect of Listerine® on dental plaque bacteria in-situ after a single rinse exposure. Analysis of vital fluorescence staining of plaque specimen from 17 subjects indicated that the essential oil mouth rinse inactivated 78.7% of bacteria with a significance value of P < 0.001.
For the CG distilled water rinsing resulted in more or less similar live and dead plaque and salivary bacterial load [Figure 2a-d]. The little difference in this case can be attributed to the washing-away-effect of distilled water. A decrease in microbial count has been reported with distilled water treatment on agar plates.[17]
Rinsing for 30 s with freshly prepared 0.1 ppm ozonated water did not cause any discomfort or adverse effect to any of the volunteers involved in the study. It did not cause any significant effect on salivary calcium and protein content. The salivary flow rate too remained unaffected. Therefore, it can be presumed that rinsing with 0.1 ppm ozonated water for 30 s may not affect the normal functioning of the saliva. The antimicrobial activity of ozonated water demonstrated in this study along with its biocompatibility with epithelial cells [26] and ease of preparation can make it a cost effective adjunct to tooth brushing and flossing. The only possible challenge is to keep the concentration in check. High concentration of ozone can have a detrimental effect on the health of the user. In addition, freshly prepared rinse water only can produce the desired antibacterial results as the gas can in no time dissociate and leave water behind. Commercially manufactured ozonated water-wending machines can be designed to instantly produce rinsing water at the desired concentration. These machines can be installed at home, offices, schools and other public places where one rinse of 30 s can reduce the plaque and salivary bacterial load to half. However, the amount of in-situ inactivation of other oral microorganism it can produce along with the prolonged effects on the oral ecosystem needs to be assessed.
Acknowledgment
We would like to thank all the volunteers who took part in the study.
Source of Support: Nil.
Conflict of Interest: None declared.s
References
- Sbordone L, Bortolaia C. Oral microbial biofilms and plaque-related diseases: Microbial communities and their role in the shift from oral health to disease. Clin Oral Investig 2003;7:181-8.
- Brand HS, Veerman EC. Saliva and wound healing. Chin J Dent Res 2013;16:7-12.
- Kuriakose S, Sundaresan C, Mathai V, Khosla E, Gaffoor FM. A comparative study of salivary buffering capacity, flow rate, resting pH, and salivary Immunoglobulin A in children with rampant caries and caries-resistant children. J Indian Soc Pedod Prev Dent 2013;31:69-73.
- Mandel ID. The functions of saliva. J Dent Res 1987;66 Spec No: 623-7.
- Laible NJ, Germaine GR. Bactericidal activity of human lysozyme, muramidase-inactive lysozyme, and cationic polypeptides against Streptococcus sanguis and Streptococcus faecalis: Inhibition by chitin oligosaccharides. Infect Immun 1985;48:720-8.
- Dowd FJ. Saliva and dental caries. Dent Clin North Am 1999;43:579-97.
- Tabak LA, Levine MJ, Mandel ID, Ellison SA. Role of salivary mucins in the protection of the oral cavity. J Oral Pathol 1982;11:1-17.
- Kreusser W, Heidland A, Hennemann H, Wigand ME, Knauf H. Mono-and divalent electrolyte patterns, pCO2 and pH in relation to flow rate in normal human parotid saliva. Eur J Clin Invest 1972;2:398-406.
- Lagerlöf F, Ekstrand J. The effect of flow rate on the ionized calcium concentration of human parotid saliva. Caries Res 1982;16:123-8.
- Cortelli SC, Cortelli JR, Shang H, McGuire JA, Charles CA. Long-term management of plaque and gingivitis using an alcohol-free essential oil containing mouthrinse: A 6-month randomized clinical trial. Am J Dent 2013;26:149-55.
- Vlachojannis C, Magora F, Chrubasik S. Rise and fall of oral health products with Canadian bloodroot extract. Phytother Res 2012;26:1423-6.
- Ciancio SG. Agents for the management of plaque and gingivitis. J Dent Res 1992;71:1450-4.
- Kumar S, Patel S, Tadakamadla J, Tibdewal H, Duraiswamy P, Kulkarni S. Effectiveness of a mouthrinse containing active ingredients in addition to chlorhexidine and triclosan compared with chlorhexidine and triclosan rinses on plaque, gingivitis, supragingival calculus and extrinsic staining. Int J Dent Hyg 2013;11:35-40.
- FDI Commission. Mouthrinses and dental caries. Int Dent J 2002;52:337-45.
- Putt MS, Proskin HM. Custom tray application of peroxide gel as an adjunct to scaling and root planing in the treatment of periodontitis: A randomized, controlled three-month clinical trial. J Clin Dent 2012;23:48-56.
- Sadatullah S, Mohamed NH, Razak FA. Ozone in dentistry: What dentists should know about this gas? J King Saud Univ Dental Sci 2010;22:83-7.
- Nagayoshi M, Fukuizumi T, Kitamura C, Yano J, Terashita M, Nishihara T. Efficacy of ozone on survival and permeability of oral microorganisms. Oral Microbiol Immunol 2004;19:240-6.
- Syed SA, Loesche WJ. Survival of human dental plaque flora in various transport media. Appl Microbiol 1972;24:638-44.
- Loesche WJ. The specific plaque hypothesis and the antimicrobial treatment of periodontal disease. Dent Update 1992;19:68, 70-2, 74.
- Boulos L, Prévost M, Barbeau B, Coallier J, Desjardins R. LIVE/DEAD BacLight: Application of a new rapid staining method for direct enumeration of viable and total bacteria in drinking water. J Microbiol Methods 1999;37:77-86.
- Tawakoli PN, Al-Ahmad A, Hoth-Hannig W, Hannig M, Hannig C. Comparison of different live/dead stainings for detection and quantification of adherent microorganisms in the initial oral biofilm. Clin Oral Investig 2013;17:841-50.
- Sadatullah S, Mohamed NH, Razak FA. The antimicrobial effect of 0.1 ppm ozonated water on 24-hour plaque microorganisms in situ. Braz Oral Res 2012;26:126-31.
- Moran J, Addy M, Wade W, Milson S, McAndrew R, Newcombe RG. The effect of oxidising mouthrinses compared with chlorhexidine on salivary bacterial counts and plaque regrowth. J Clin Periodontol 1995;22:750-5.
- Zaura-Arite E, van Marle J, Ten Cate JM. Conofocal microscopy study of undisturbed and chlorhexidine-treated dental biofilm. J Dent Res 2001;80:1436-40.
- Pan P, Barnett ML, Coelho J, Brogdon C, Finnegan MB. Determination of the in situ bactericidal activity of an essential oil mouthrinse using a vital stain method. J Clin Periodontol 2000;27:256-61.
- Huth KC, Jakob FM, Saugel B, Cappello C, Paschos E, Hollweck R, et al. Effect of ozone on oral cells compared with established antimicrobials. Eur J Oral Sci 2006;114:435-40.
Appendix
Appendix 1: LIVE/DEAD BacLight Bacteria Viability Kit (Molecular Probes, Inc. USA)
Fluorescence staining procedure
1. Preparation of bacterial suspension 5 ml of bacterial culture was centrifuged ×10,000g for 15 min. The supernatant was discarded and the pellet was suspended in buffer solution. 0.85% sodium chloride buffer was used for live bacteria while 70% isopropyl alcohol buffer was used for dead bacteria. The pellet was suspended in the appropriate buffer and centrifuged ×10,000g for 15 min. This was repeated three times to completely wash the pellet of any traces of culture media.
2. Staining bacterial suspension The component A and component B of the LIVE/DEAD BacLight Bacteria Viability Kit were combined in equal50µl of saliva sample was added to 50 µl of distilled water and 5 ml of Bradford reagent and left for 2 min. Absorption of this was read at 595 nm. amounts and mixed thoroughly. 1 ml of washed bacterial suspension was added to 3 μl of the die mixture and incubated at room temperature for 15 min in a dark room. 5 μl of the stained bacterial suspension was taken between glass slide and cover slip and slide was ready for viewing.
Appendix 2: Salivary calcium analysis ‑ titration method
Calcium was determined using freshly prepared solution of potassium hydroxide (KOH), Ethylene diaminetetraacetic acid (EDTA) and calconindicator which was kept away from light.
To 0.2 ml of sample stock, 1 ml of 1.25N KOH and 0.1 ml of calcon indicator was added. It was immediately titrated with 0.25 ml EDTA. After the first volume (0.25 ml), EDTA was added in parts of 0.02 ml until it is turned blue. Titration was completed within 3 min because the indicator color is not stable as the rate of dissociation occurs rather fast.
Appendix 3: Salivary protein analysis ‑ spectrophotometry method
Protein was determined using freshly prepared Bradford reagent. Coomassie brilliant blue (100 mg) was dissolved in 50 ml of 95% of ethanol and 100 ml of 85% of phosphoric acid and diluted to 1 L with distilled water to make Bradford reagent. Concentration of protein was determined using 0.1 mg/ ml of bovine serum albumin stock solution to give a range of standard containing 0, 20, 40, 60, 80, 100 μg using the spectrophotometer.
50μl of saliva sample was added to 50 μl of distilled water and 5 ml of Bradford reagent and left for 2 min. Absorption of this was read at 595 nm.



 The Annals of Medical and Health Sciences Research is a monthly multidisciplinary medical journal.