Variations in the Spatial Distribution of Gall Bladder Cancer: A Call for Collaborative Action
- *Corresponding Author:
- Dr. Manigreeva Krishnatreya
Dr. B Borooah Cancer Institute, Guwahati, India.
E-mail: mani_greeva@yahoo.co.in
Abstract
Background: The incidence of gall bladder cancers in this part of the world is high and the spatial variation in occurrence of gall bladder cancers can be identified by using geographical information system. Materials and Methods: Data set containing the address information of gall bladder cancer patients from the District of Kamrup, India was obtained from cancer registry of a regional cancer center. The data set consisted of patients registered during the period of January 2010 to December 2012. The ArcGIS 10.0 used for the present analysis and the population density map of the District was prepared by using LandScan, 2008™. Results: There were isolated areas with very high density of cases and low population density termed as “hot spots”. Alternatively there were areas with very high population density and lesser number of cases with gall bladder cancers. Conclusion: This type of an analysis using GIS provides evidence to conduct joint research by epidemiologists and specialists from environmental and geological sciences in tandem.
Keywords
Gall bladder cancer, geographical information system, Kamrup, India, spatial variations
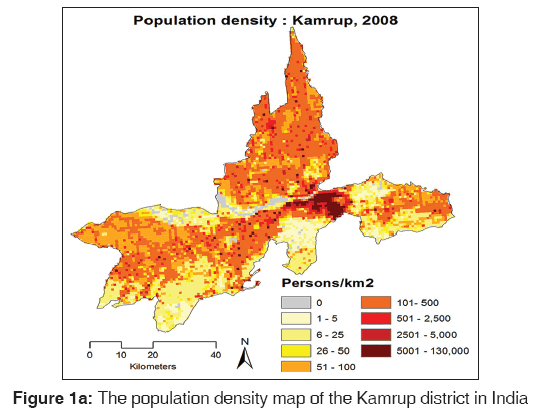
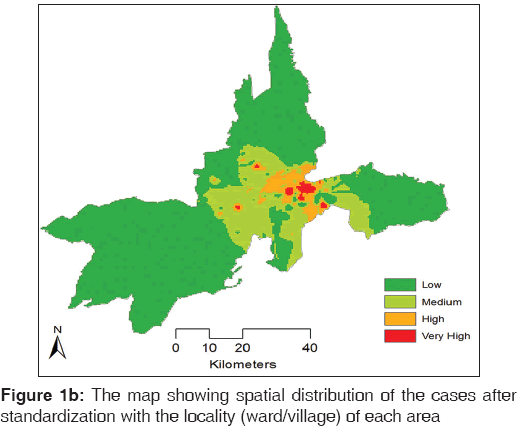
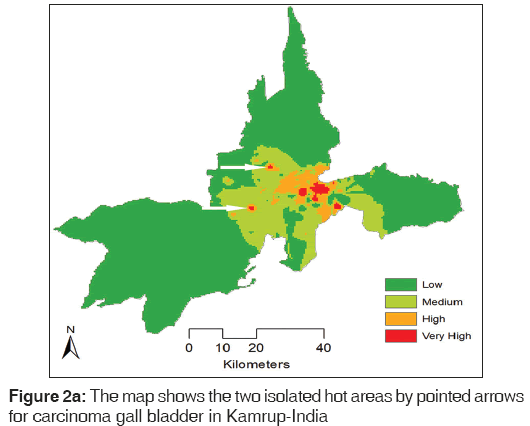
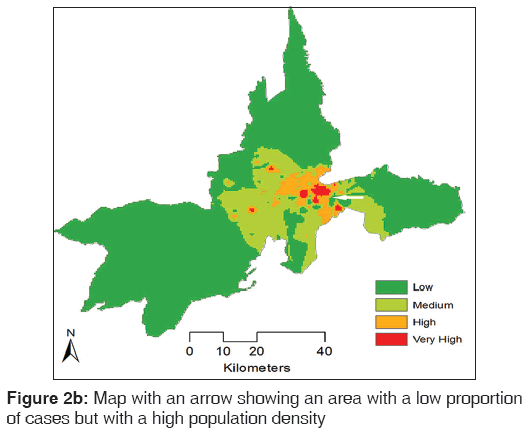
Mapping of cancer data using geographical information system (GIS) is a common practice in the developed countries for measuring the cancer burden in a given geographical area. However, such a tool has not been used in a limited resources country like India, where there is a high age adjusted incidence rates (AAR) of certain cancers in specific geographical regions within the country.[1] There is a marked variation on the geographic distribution of carcinoma gall bladder within this geographical region. GIS of cancer can identify key areas within a geographical region where the high AAR cannot be solely explained by known risk factors. AAR of gall bladder cancer ranges from 0.3 –7.4/100,000 population in males to 0.1 –14/100,000 populations in females in India.[1] The AAR of carcinoma of gall bladder in females of our registry area (Kamrup-Urban) is 14/100,000 populations, which is second to the highest (Chile) in the world and AAR of carcinoma gall bladder is 7.4/100,000 male population, the AAR of carcinoma gall bladder in males is highest in the country.[1,2] Nandakumar et al. had identified this part of the country as a geographically high risk area for carcinoma of the gall bladder.[3] Using a GIS tool, we had tried to see the spatial distribution (geographical distribution) of cancers of the gall bladder. The data set consisted of cases of gall bladder cancer from the district of Kamrup-India for the period of January 2010-December 2012 and it was obtained from the hospital cancer registry of a regional cancer center in Eastern India. Strict confidentiality of patient information was maintained, while handling the data sets. Only cases that were resident in the area for at least 10 years were considered for the present analysis. The address information of 230 cases was used for mapping with GIS. The Kamrup district is spread over an area of 2740 km2. The population density map of the district was prepared by using LandScan, 2008™ [Figure 1a]. According to the census of 2011, Kamrup district had a population of 1,517,542 of which male and female were 778,461 and 739,081 respectively. The population density is variable in this district. The population ranges from 1 to 5 persons/Km2 in rural areas to 5000-130,000 persons/km2 in the urban areas. Patient information was imported from a spreadsheet program into a GIS by address matching the patient locations within ward/village boundaries. The ArcGIS 10.0 was used. Thereafter a count for the number of cancer cases/ward/village boundary was used as a weightage in running a Kriging analysis to interpolate cancer map for the entire district [Figure 1b]. Kriging is a widely used technique and has been used recently.[4] The proportions of the cases were centered based on the population density of the region. The focal areas where the proportions of cases were very high, they have been labeled by red color (very high) in the maps, and we have tentatively remarked them as “hot spots” and consequently areas with a low proportion of cases were labeled as green areas on the map. The areas with a high proportion of cases of carcinoma gall bladder were in the urban areas of the district, where the population is also high. However, there were isolated areas with low population density, but an increasing proportion of cases of carcinoma gall bladder for the area were seen [Figure 2a]. Interesting to note was that in areas where the population was high (5000-130,000 persons/km2), there were areas with a low proportion of cases for the area, which were marked as green areas [Figure 2b].
Use of GIS of cancer for investigating into environmental risk factors of esophageal cancers has been advocated.[5] Area with a high number of cases of carcinoma of the gall bladder within the geographical region with a comparative lesser population density is significant in the view of the following; similar terrestrial condition of the entire district, and the similar dietary and lifestyle pattern of the entire population of the district. Moreover, in view of high levels of ground water arsenic in this region,[6] and the carcinogenic potential of arsenic in the causation of cancers of skin, lungs, and urinary bladder,[7] there is a concern that ground water arsenic may be responsible for such spatial variations. Geographical regions with high population density vis-à-vis less proportion of cancer cases can serve as control regions for epidemiological research.
Geographical information system on cancer data serve to identify “hot spots” of cancers within a geographical region keeping in mind the population density of the area. This type of an analysis using GIS provides evidence to conduct joint research by epidemiologists and specialists from environmental and geological sciences in tandem.
Acknowledgments
The population map of Kamrup district was prepared utilizing the LandScan (2008)™ High Resolution global Population Data Set copyrighted by UT-Battelle, LLC, operator of Oak Ridge National Laboratory under Contract No. DE-AC05-00OR22725 with the United States Department of Energy. The United States Government has certain rights in this data set. Neither UT-Battelle, LLC nor the United States Department of Energy, nor any of their employees, makes any warranty, express or implied, or assumes any legal liability or responsibility for the accuracy, completeness, or usefulness of the data set. National Centre for Disease Informatics and Research under the Indian Council of Medical Research for providing the technical support.
Source of Support
Nil.
Conflict of Interest
None declared.
References
- Consolidated Report of Population Based Cancer Registries of India, 2009-2011. Bangalore: ICMR, NCDIR; 2013.
- Andia KM, Gederlini GA, Ferreccio RC. Gallbladder cancer: Trend and risk distribution in Chile. Rev Med Chil 2006;134:565-74.
- Nandakumar A, Gupta PC, Gangadharan P, Visweswara RN, Parkin DM. Geographic pathology revisited: Development of an atlas of cancer in India. Int J Cancer 2005;116:740-54.
- Asmarian NS, Ruzitalab A, Amir K, Masoud S, Mahaki B. Area-to-area poisson kriging analysis of mapping of county-level esophageal cancer incidence rates in Iran. Asian Pac J Cancer Prev 2013;14:11-3.
- Wu KS, Huo X, Zhu GH. Soil and vegetation characteristics of high- and low-risk areas of esophageal cancer in China. Asian Pac J Cancer Prev 2007;8:597-601.
- Chetia M, Chatterjee S, Banerjee S, Nath MJ, Singh L, Srivastava RB, et al. Groundwater arsenic contamination in Brahmaputra river basin: A water quality assessment in Golaghat (Assam), India. Environ Monit Assess 2011;173:371-85.
- IARC Monographs on the Evaluation of Carcinogenic Risks to Humans. Vol. 84. WHO; IARC. Available from: http//www.monographs.iarc.fr/ENG/Monographs/ vol84/volume84.pdf. [Last accessed on 2014 Mar 08; Last updated on 2004].


 The Annals of Medical and Health Sciences Research is a monthly multidisciplinary medical journal.